Home > Evidence from the field: Part 1
Evidence from the field
Part 1: Overview
A field study with one hundred participants was conducted to determine the practicality of the Mood Cow system as a preventive intervention tool. The study was designed to answer two questions.
- Can the system identify risk and protective factors for psychological states?
- Can people of the general public understand and use the system?
These two questions directly address utility and usability, respectively, that define practicality. Identifying risk and protective factors is critical to preventive interventions. If a tool can do so for the general public, and people can use it, then by definition, it's a practical tool.
The field study confirmed the affirmative answers to both questions, and provided an empirical evidence that the Mood Cow system is a practical preventive intervention tool.
A brief explanation of the Mood Cow system
The Mood Cow system is a method of capturing and representing influential factors that affect emotional well-being, positively and negatively. The system builds a conceptual model of risk and protective factors as a general structure that comprises six categorical variables derived from three dimensions of health (physical, social, mental well-being) and two orientations of influence (external, internal):
- External social influencer (ESI)
- Internal social influencer (ISI)
- External physical influencer (EPI)
- Internal physical influencer (IPI)
- External mental influencer (EMI)
- Internal mental influencer (IMI)
Each categorical variable takes two observation values: positive and negative. The values conceptually and categorically reflect protective factors and risk factors, respectively; however, they are not intended to identify specific elements in precision.
By capturing the observation value counts for all variables in a given time period, one can construct a personalized profile of risk and protective factors. The quantitative profile allows statistical analysis and visualization at an individual level and a population level.
Method
One hundred factory workers in northern Japan were asked to record their mood, negative influencers, and positive influencers everyday for 20 days from April 25 to May 14, 2016. The workers are mostly high school graduates but some with college degrees. Each participant was given a score sheet to record data at home (see sample below).
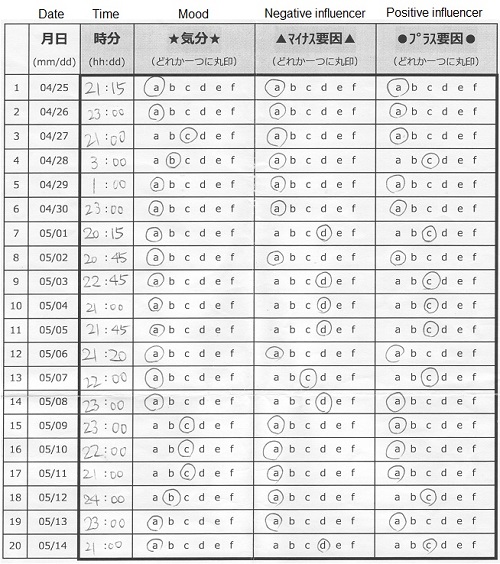
Fig.1 Sample score sheet used in the field study
-
Note: Paper score sheets are used in this study in order to focus on the system utility, not software utility.
On the score sheet, participants were asked to write down the time of record, and mark one of six choices for mood, negative influencers, and positive influencers. No training or explanation about the selections of mood and influencers was given, except a few descriptive keywords on the score sheet as shown below.
Mood:
a) Fine / Happy, b) Tired, c) Anxious, d) Sad, e) Agitated / Angry, f) Depressed.
Negative influencers:
a) (ESI) Stress from work, school, family, friends (exclude bullying), financial problems, accidents, other social events and circumstances.
b) (ISI) Low self-esteem, negative personality (pessimism, perfectionism).
c) (EPI) Medications, alcohol, domestic violence, bad weather.
d) (IPI) Poor physical health (illness, injury, lack of sleep, exhaustion).
e) (EMI) Bullying at work, school, home, neighborhood, cyber-bullying.
f) (IMI) Symptoms of mental disorder.
Positive influencers:
a) (ESI) Work, family, friends, performance, festivals and events.
b) (ISI) Good self-esteem, positive personality, motivation, strong will.
c) (EPI) Activities, food, medication, music, hobby, exercise, travel, good weather.
d) (IPI) Good physical health.
e) (EMI) Goodwill by someone, charity, spiritual activities.
f) (IMI) Faith, Praying.
Also on the score sheet, the participants were asked to mark their gender, age group, and a multiple choice answer to the following question: "Did you understand the meaning of negative and positive influencers?".
Participation was voluntary, and no incentive or reward was given to the participants. No feedback or visual aid (e.g. graphs) was provided to the participants. After the 20-day period, all one hundred score sheets were retrieved.
Key Finding 1
The majority of participants (65%) understood the meaning of negative and positive influencers for their mental well-being.
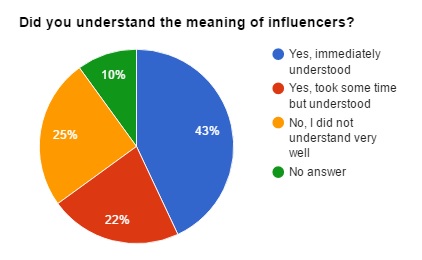
Fig.2 Participant response to user question
To the question of "Did you understand the meaning of negative and positive influencers?", 43% of the participants responded "Yes, immediately understood." 22% responded "Yes, took some time but understood." 25% responded "No, I did not understand very well." 10% did not answer the question.
Lack of clarification about the terms "positive" and "negative" may have confused people who responded that they did not understand very well. On the score sheets, some participants marked positive influencers but no negatives when they were feeling fine, and marked negative influencers but no positives when they were not feeling fine. Better use of terms and explanations may have avoided their confusion.
Considering the fact that all one hundred score sheets were completed, albeit some blank spots, and the fact that the study did not provide any detailed explanation of the influencers, the results provided a strong evidence that the general public can understand and use the Mood Cow system, even in the paper form.
Key finding 2
Risk and protective factors were identified for individuals and the entire group.
During the 20-day period, seventy six out of one hundred participants (76%) marked "Tired" at least once, forty six people (46%) marked "Sad", forty five people (45%) marked "Anxious", twenty six people (26%) marked "Angry", and thirteen people (13%) marked "Depressed".
What are the factors that make them feel in certain ways, and how are they coping with them? They are important questions from a public health perspective.
How is a specific individual feeling, what is affecting this person, how is this person coping with it, and does this person need help? If so, how? They are important questions from a clinical practice perspective.
These questions can only be answered if there is a tool that can identify risk and protective factors at an individual level and a population level. The field study data show that the Mood Cow system is capable.
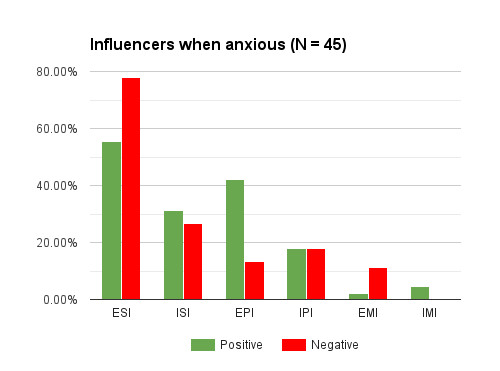
Fig.3 Influencers when feeling anxious (population view)
Forty five out of one hundred participants (45%) noted that they felt anxious at least once during the 20-day period. Fig.3 shows the percentage of people who selected particular influencers when feeling "Anxious". The figure depicts the consolidated profile of the risk and protective factors for this group.
Social stress is by far the number one factor for their anxiety (Negative ESI 78%), followed by ISI 27% and IPI 18%. Having EMI at 11% means that five people are experiencing anxiety because of bullying. Another external influencer EPI is at 13%, meaning that six people are experiencing anxiety because of some external physical elements, potentially drugs or domestic violence.
Positive influencers are more spread. The top two, ESI 56% and EPI 42% indicate that the majority rely on social and physical factors to cope with their anxiety. However, ISI at 31% means that almost one third of the group rely on their personal will and strength for coping. In other words, they are "toughing it out" alone. Many mental health experts, especially suicide specialists know that relying on self-will without seeking outside help is not a good coping approach.
Fig.4 through Fig.8 show the consolidated profiles of the risk and protective factors for other mood types.
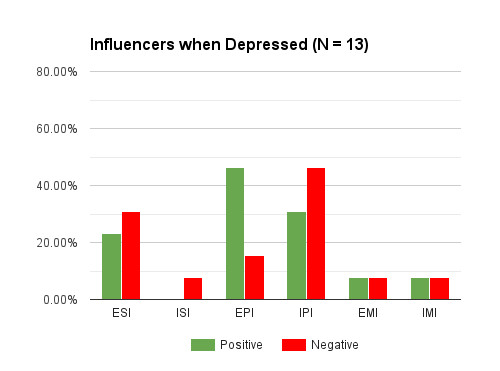
Fig.4 Influencers chosen when feeling depressed (population view)
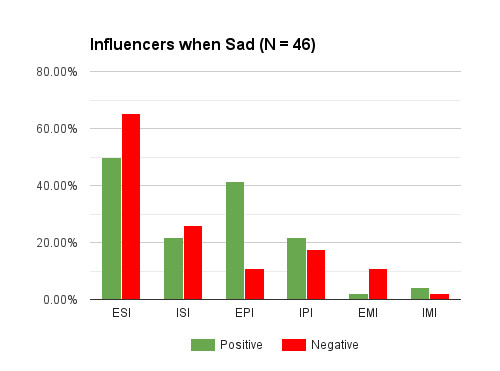
Fig.5 Influencers chosen when feeling sad (population view)
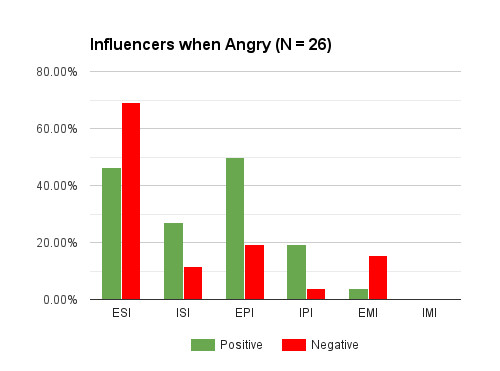
Fig.6 Influencers chosen when feeling angry (population view)
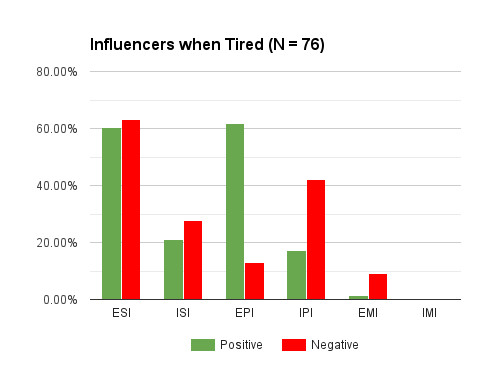
Fig.7 Influencers chosen when feeling tired (population view)
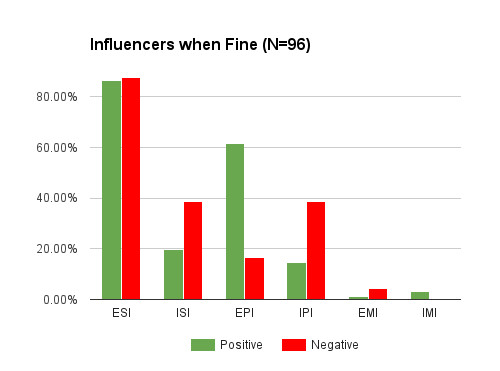
Fig.8 Influencers chosen when feeling fine (population view)
While the above analysis provides insights at a population level, what about an individual level?
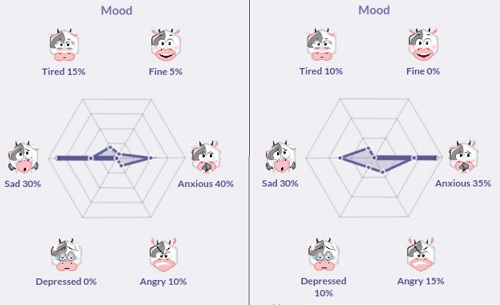
Fig.9 Mood distribution of two individuals (Data#051, #052)
Fig.9 shows two individuals' mood distribution over the 20-day period. Notice that they appear very similar. They both felt anxious (40% & 35%), sad (both 30%), angry (10% & 15%), tired (15% & 10%), and fine (5% & 0%) at an almost identical rate. Without knowing their risk and protective factors, we would falsely assume that they need similar intervention support.
Fig.10 shows their influencer distributions. Notice how different they appear. Even though their mental well-being may be similar, their risk and protective factors are very different.
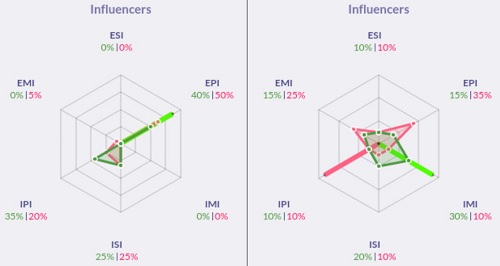
Fig.10 Influencer distribution of two individuals (Data#051, #052)
The left side (Data#051) has high negative EPI (50%), and moderate ISI (25%) and IPI (20%). This individual is not suffering from social stress but suffering from external and internal physical elements. This individual's positive influencers are EPI (40%), IPI (35%), and ISI (25%).
The right side (Data#052) on the other hand has more spread profile with negative EPI (35%), negative EMI (25%), and the rest at 10% each. Negative EMI 25% indicates a moderate influence of bullying. This individual's positive influencers are also spread with positive IMI (30%), ISI (20%), and the rest at 10 to 15% each. Positive IMI means faith and spiritual, and positive ISI means self-will, indicate strong reliance on self-help.
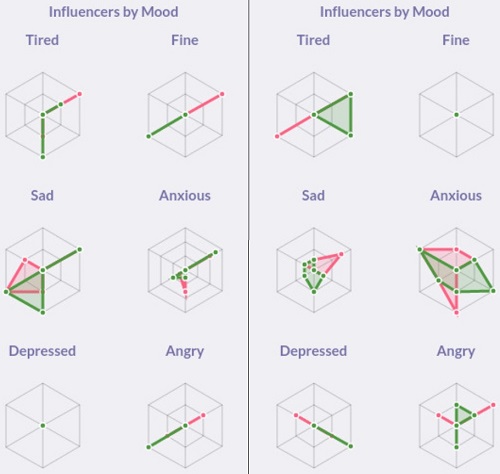
Fig.11 Influencer choice by mood types (Data#051, #052)
Fig.11 shows the two individuals' influencer choice by mood types. The difference is clear. For example, when feeling anxious, the person on left marked EPI and ISI only, indicating that anxiety comes from physical elements and low self-esteem. The person is relying mostly on physical elements to cope with anxiety.
The person on right suffers from multiple influencers, most notably negative EMI, indicating bullying is causing anxiety. The positive influencers are EMI and IMI, indicating that the person is relying on spiritual experience and goodwill to cope with anxiety.
- The images for Figs.8, 9, and 10 were created by using Mood Cow Dashboard after manually entering the participant's score sheet data.
